Contents

7.3.2 Processing parameters
7.3.2.1 Windowing
Window length
| Table 1: Parameters to define the windows length | ||||||||||||
|
In order for a measurement to be reliable, it is strongly recommended to fulfilled the following condition: the window length has to be larger than 20-50 times the period of interest.
Anti-triggering
A detailed description of the anti-triggering algorithm can be found in section 7.1.3
To apply the "anti-trigger" algorithm on the current noise signals, check the box "Anti-triggering on raw signal" and activate the "Raw signal" tab to select the appropriate values. Indicate the values of the short term average "STA" and the long term average "LTA", as well as the values of the minimun and the maximun STA/LTA ratio in the corresponding box. You can apply the anti-trigger algorithm to all signals (vertical component), or only to some stations (check/uncheck the name of the selected station in the station name list on the right side of the tab).
Bad sample tolerance/threshold
These two options allow you to optimise the number of selected windows. When the bad sample option is turn on, the algorithm of windows selection is slighty modified: although several points do not satisfy the anti-triggering criteria, the current window can be selected. The number of bad sample which are keept to define one 'good' window is defined by INT("bad sample tolerance"/deltaT). In the same way, you can defined the total amount of 'bad signal' in each window you want to keep by turning on the "Bad sample threshold" option. In this case, you give the number of 'bad point' in term of percentage of the total number of points by window.You can turn on these two options in the same time.
Overlapping
If the total time duration of the noise signal is too short and/or if the number of selected windows is too small, you can use the overlapping option. To turn on this option, simply click on the "overlap by" box and give the specified amount of overlapped windows in percentage (Figure 8).
The number of point overlapped at the end of each window is given by INT(time*overlap/deltaT), where "time" is the window length in second, "overlap" the amount of overlapped windows in percentage and deltaT the time step.
7.3.2.2 Time duration (Time limits)
This option allow you to select the portion of signal you want to analyse. Click on "From" and "To" buttons in the "Time Limits" tab to specify the beginning time and the ending time:
| Table 2: Parameters to define the time duration of analysed signal | ||||||||||||||||||||||||
|
If you click on the "Test" button, then the selected signal is displayed in the graphic viewer and shaded in green. The yellow squares indicate the time window length.
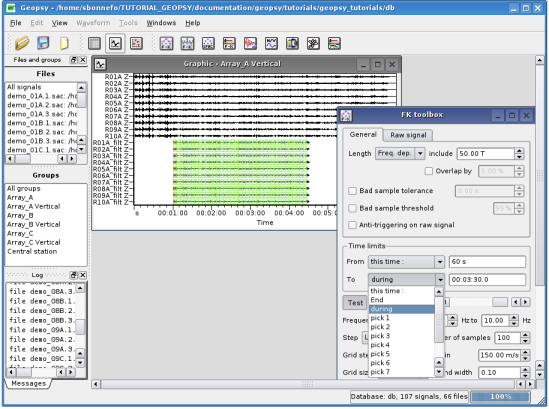
Figure 1: Selection of the time limits of the signal for the 2D array wavenumber computation
7.3.2.3 Computation parameters
The following table summarizes the available keyword, value types and allowed value ranges for the processing parameters.
| Table 3: description of the computation parameters | ||||||||||||||||||||||||||||||||||||||||
|
7.3.2.4 Test
This tool allow you to check the reliabily of the results before the computation. Select the frequency of interest (by moving the frequency navigation bar) and click on "Test" button, then the computed beampower in wavenumber plan (Kx,Ky) appears in the 'Time window browser'. Beampower maxima are displayed in purple. By moving the "time window" navigation bar, you can visualise the beampower for a given time window, the corresponding time window is shaded in red in the graphic viewer. At your convience, you can also change the value of the testing frequency.
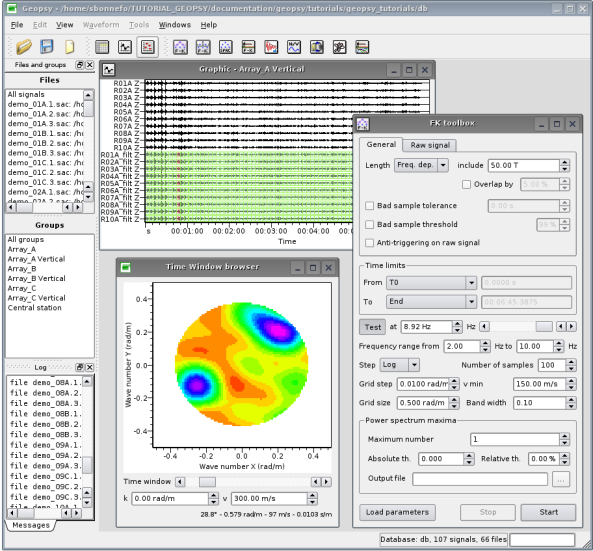
Figure 2: Test of the capabilities of the FK or HRFK to estimate the phase velocity for a given frequency and a time window
7.3.2.5 Power spectrum maxima
7.3.2.6 Output files and start the processing
Give the name of the file (.max) where the results will be saved in the dialog box "Output file". Alternatively you can choose an existing file by opening the browser and select the wanted path. To do this, click on the icon ![]() .
.
To start the computation, click on "Start" button. The status of the computation is automatically written at the bottom left side of the geopsy sheet.
If necessary, stop the computation by clicking on the "Stop" button. In this case, only the partial results will be saved.
