
1. Introduction
This manual documents how to use Geopsy as well as the tools developed for ambient vibration processing. It corresponds to version 2.0.0.
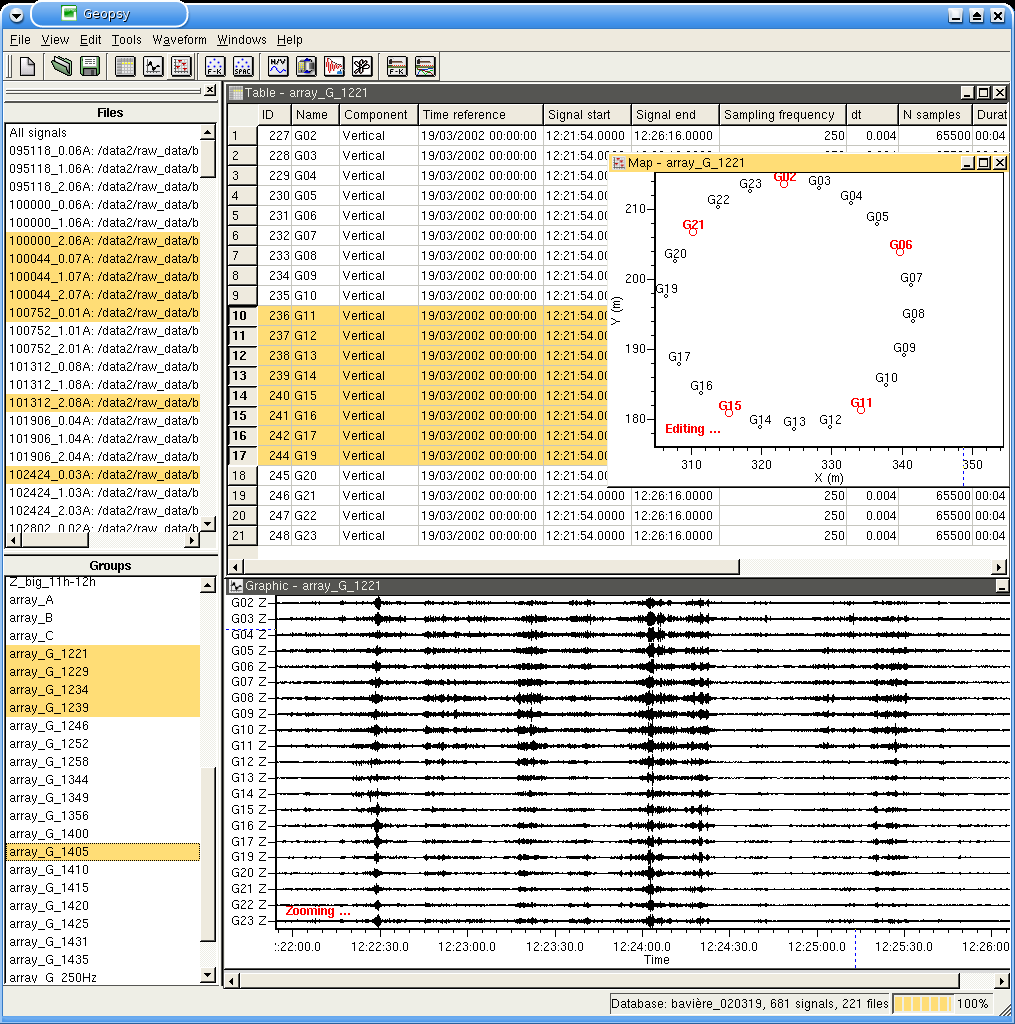
Figure 1: Main frame of Geopsy. On the left, the File and Group navigation bars. On the right, the three kinds of viewers: table, graphic and map.
Geopsy is a graphical user interface for organising, viewing, and processing geophysical signals. These three aspects are detailed hereafter and they are illustrated in figure 1 by a screen capture. Geopsy is also a database used to gather all information about recorded signals. External command line or GUI programs can access this database, enjoying the optimised core library designed for very long signals (hours of recording or tens of millions of samples).
Though extensions to other scientific or engineering fields are potentially possible, this software has been primarily designed for seismology and seismic prospecting. It is available under all common platforms (Linux, Mac OS X, and Windows) and released for free under the GNU Public License. Please refer the installation section for details.
Database
Various common signal file formats can be loaded. These formats are automatically recognised to simplify the access to the measured signals. Reading the original file format is usually better than using conversion tools where data losses are likely to occurs (e.g. correction factors).
There is virtually no limit to the number of signals that can be loaded at the same time. Once loaded, the signals can be grouped in ordered lists (groups) and supplementary information can be added to each trace (signal name, X Y Z coordinates, picks, ...). These data cannot be stored in all types of file headers due to the heterogeneities of the signal file formats.
For this reason, a database is generated to gather in an independent and handy way all information. A database is stored under a .sdb file that lists all signal files corresponding to a particular project or site. Hence, the signals are not duplicated when creating a database, keeping links to the original signal files and saving disk space. One interest of databases is to reload all signal files of a project with a simple click. Each database is affected a directory containing the .sdb file plus other secondary files.
New files are automatically added to the database when a trace is modified (Processing) and saved inside the database directory with a quick access format (binary). The original signals are still present in the database.
Viewers
They are three ways of viewing the signals in Geopsy: Table, Graphic and Map. Each viewer is a floating window in the main Geopsy frame that contains a sub list of signals currently loaded (with or without a database created). According to each viewer, it is possible make a selection of signals and to create another viewer containing only the selected signals (drag and drop mechanism).
The table shows textual information about each signal (one per row). The number of columns and the data displayed is entirely configurable. Each field can be directly edited. For long signals (millions of samples), it is handy to select signals with a table because only the header information is loaded into memory, the whole traces are not loaded from files. The contents of tables can be exported and imported to ASCII files.
The graphic shows the signal themselves with a time scale. Various options are available for plotting traces (e.g. variable black area, normalisation, colour scale, ...). All signals are stored as time series. However, they can be plotted as frequency spectra after Fourier transforms. A zooming facility has been implemented to ease data inspection. Selecting only one signal inside a graphic viewer is not possible, they are all selected by default.
The map shows a 2D map of the signal coordinates. Scales of axis are automatically adjusted to fit the coordinate range. Selection of signals can be performed directly with mouse picks.
Processing
Geopsy proposes two kinds of signal processing tools:
- Basic processing (menu "Waveform"): filters, Fourier transform, taper, cut , DC removal, merge, subtract, multiply, ... These transformations directly affect the signals and the results are automatically updated on the screen. Reverting to the original is always possible. On saving a database, the modified signals are saved with a raw binary format (best I/O performances) into the database's directory. Both the original and the modified signals remain accessible in the database.
- Advanced processing (menu "Tools"): these are tools developed for special purposes. A plug-in mechanism allows you to add new tools without upgrading the main Geopsy frame. Originally, the available tools were dedicated to the analysis of ambient vibrations. The development of new specialised tools are pretty welcome (Developers).
Scripting
In certain cases, the graphical user interface may not be useful especially for repetitive tasks. Thanks to Qt Script for Application (QSA from Trolltech), it has been possible to propose a versatile scripting language to execute any of the functions available with mouse clicks. These scripts can be launched from the command line allowing its inclusion into complex bash scripts, for instance.
The available functions within a script currently do not cover the whole functionalities of Geopsy. The users are particularly encouraged to give their feedback on this topic to accelerate the development on the most popular tools ( ).
).
